Level : Intermediate
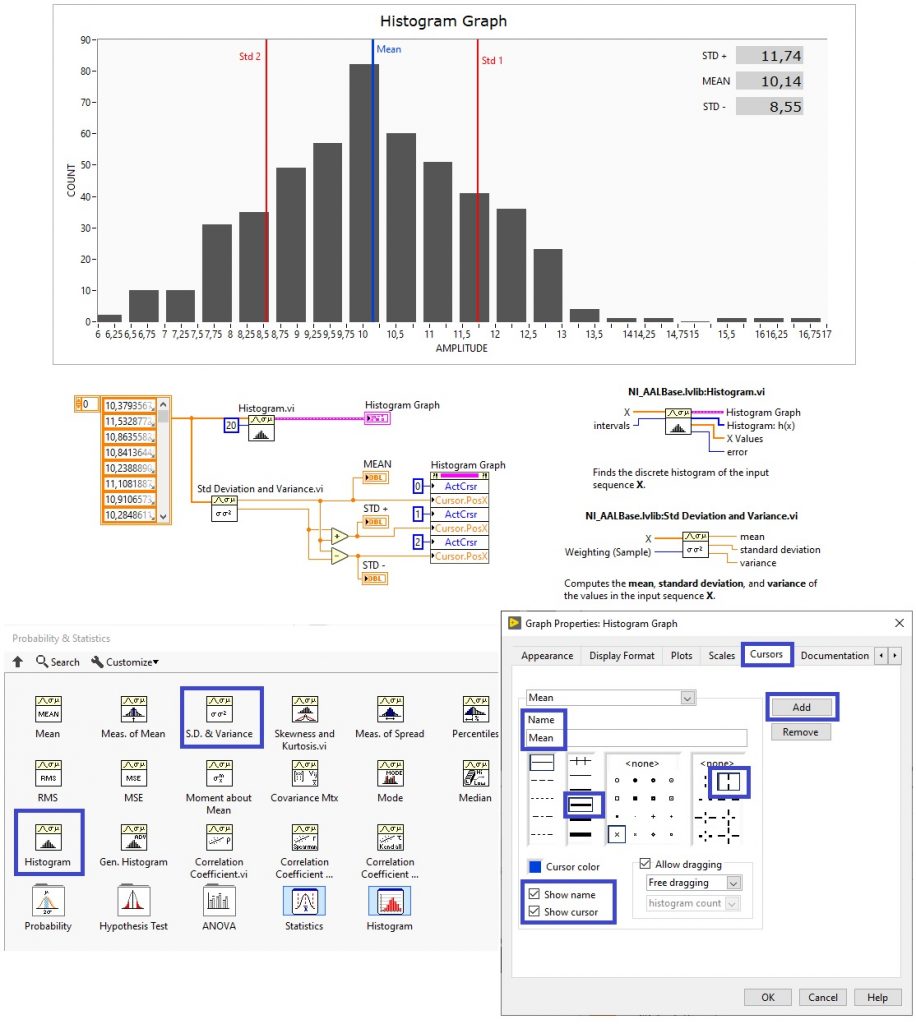
We can make a histogram with an XY graph in bar mode, to make it easier to create the bars, there is a ‘Histogram’ function on the probability and statistics palette. Using the cursors we can mark some values such as the mean and standard deviation.